Collecting more events is not the same as learning more
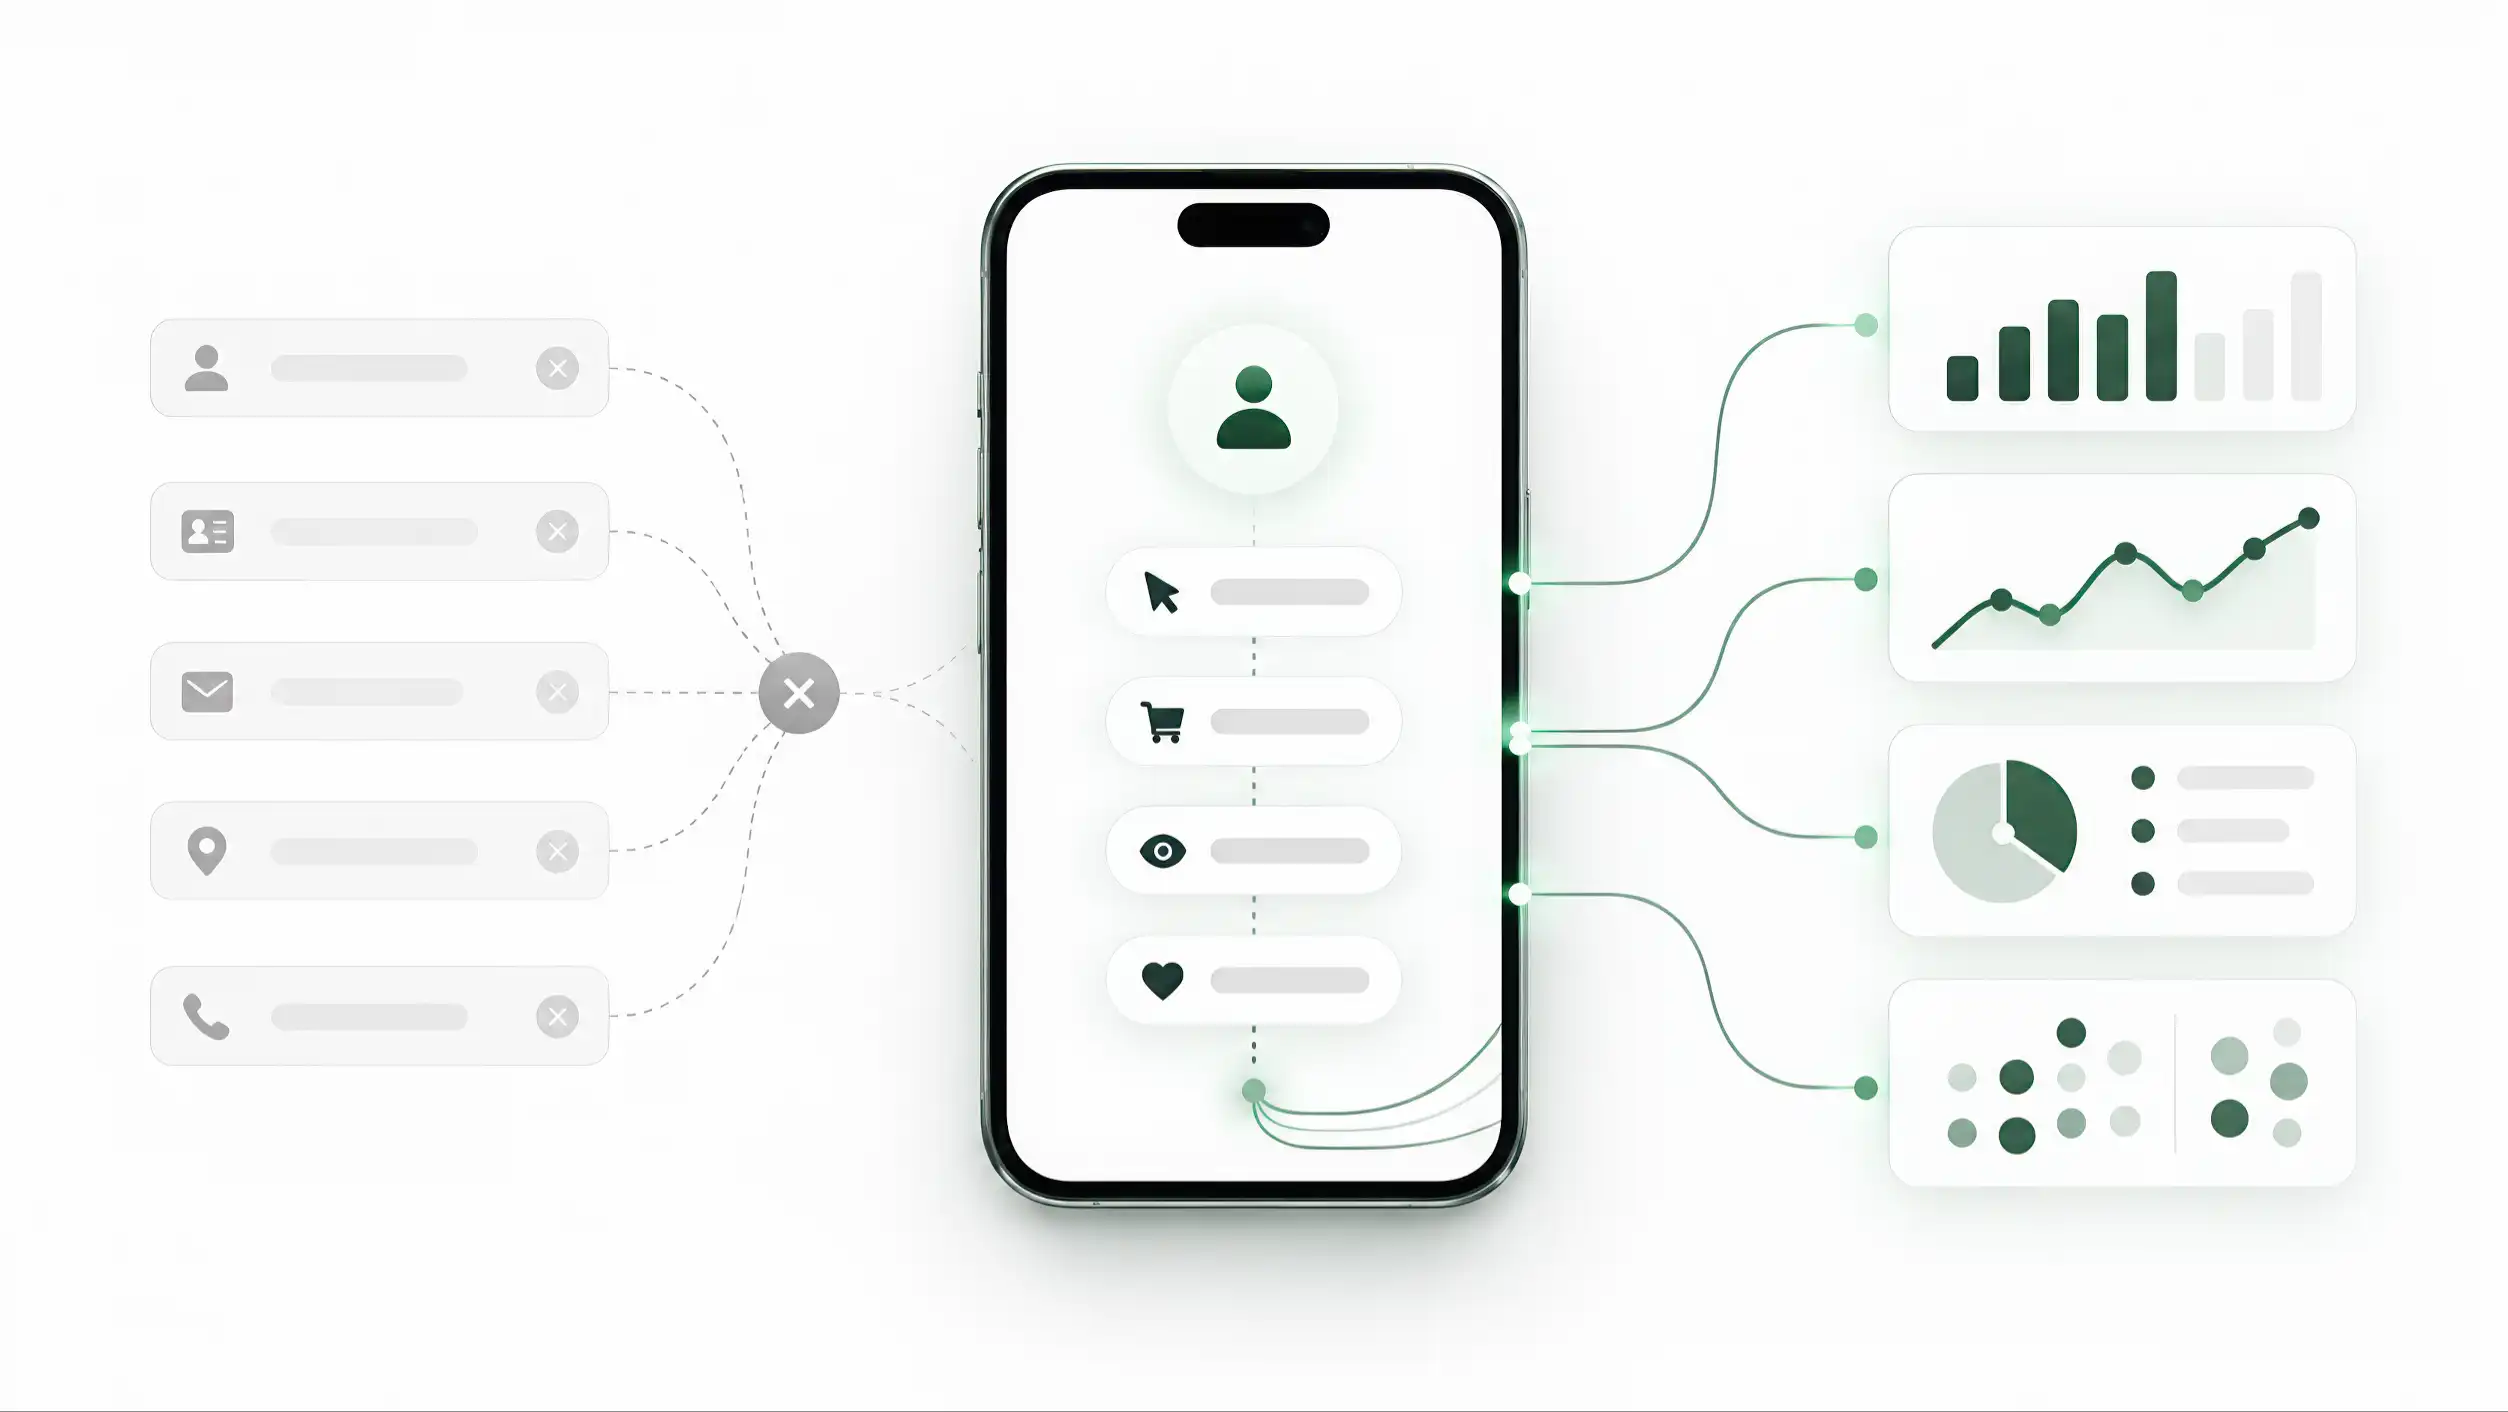
Digital products can record almost every visible interaction. A profile opens. A visitor scrolls. A button receives a tap. A social link is opened. A contact is saved. A phone action is started. WhatsApp is launched. A map is requested. A booking flow begins. A form is submitted. A purchase may eventually be completed. The technical list can become long very quickly.
That capability creates a measurement problem rather than solving one. If every event is shown with equal prominence, the dashboard becomes an inventory of activity. It can prove that things happened, but it does not explain which behaviors deserve attention or what the business should do next. A hundred event names can produce less clarity than five well-defined measures.
Avinash Kaushik’s Web Analytics 2.0 frames analytics around using quantitative and qualitative evidence to improve customer experience and desired outcomes. The important word is outcomes. The purpose of an analytics system is not to celebrate the fact that instrumentation exists. It is to create evidence that improves decisions.
The first discipline is therefore editorial as much as technical: decide what deserves to be visible. Some interactions are useful diagnostics. Some indicate interest. Some indicate intent. Some are only intermediate steps. Some are genuine outcomes. Those categories should not be collapsed into one generic “clicks” number.
A measurement plan should begin before the dashboard. For each event, write a plain-language definition: what exactly causes it to fire, why it is collected, what question it helps answer, and what it must not be interpreted to mean. That last part matters. A tap on a phone button means the visitor expressed intent to call; it does not prove that a conversation happened. A tap on WhatsApp does not prove a sale. A booking-page open does not prove a completed booking.
This distinction protects the business from false confidence. It also makes analytics easier to maintain. When a new feature is added, the team can ask whether the new event fills a real information gap or merely adds another line to a report. Lean Analytics makes a similar distinction between metrics that help a team act and vanity metrics that mainly look impressive. A digital business card should use the same discipline.
The goal is not “track less” as a slogan. Raw events can still be useful for debugging and investigation. The goal is to prioritize selectively. Collect what has a clear purpose, define it precisely, and make the important signals easier to see than the background noise.
Start with the job the profile is supposed to do
The value of an action depends on the job of the profile. There is no universal ranking in which one button is always “high intent” and another is always weak. Context changes the meaning.
For an independent consultant, the strongest path may be a qualified enquiry or a booked meeting. Saving the contact can be useful, but it may be a supporting signal rather than the primary result. For a sales representative, a call or WhatsApp conversation may be central because the profile exists to reduce friction between introduction and conversation. For a restaurant, directions, menu access, a reservation, or a direct order can matter more than saving a contact. For a review stand, sending a satisfied customer into the review flow may be the entire purpose. For a pet tag, identification and a successful contact action can be far more important than browsing time.
The same visible event can therefore carry different weight. “Directions” may be a secondary convenience on a consultant’s profile but a strong commercial signal for a physical venue. “Save contact” can be valuable for networking but much less relevant for a one-time menu interaction. A social click can be useful for an artist whose portfolio lives on that platform and mostly decorative for another business.
This is why measurement should start with a job statement. Before choosing events, write one sentence: “This profile exists primarily to help the visitor ______.” Then define one or two primary actions that represent useful progress toward that job. Secondary actions can still be measured, but they should not compete with the primary purpose in the dashboard.
The profile may also serve different audiences. A business-development card used at a trade show may attract prospects, partners, suppliers, and job candidates. Their useful next actions differ. That does not mean the analytics model must become infinitely complex. It means the event taxonomy should preserve enough context to interpret behavior later instead of assuming that every visit has the same purpose.
A useful classification is to separate the business job from the interface element. “WhatsApp button” is an interface label. “Start a sales conversation” is the business job. If the interface changes from WhatsApp to a form or booking tool, the business meaning can remain comparable. Designing the measurement model around intent makes it more durable than designing it around today’s button names.
Conversion efficiency is a separate question from measurement definition. Before asking whether traffic is producing useful progress, the business must define what should count as useful progress in the first place and how to instrument it honestly. That answer cannot come from a generic list; it has to come from the job the profile is expected to perform.
Build an intent hierarchy, but do not pretend it is universal
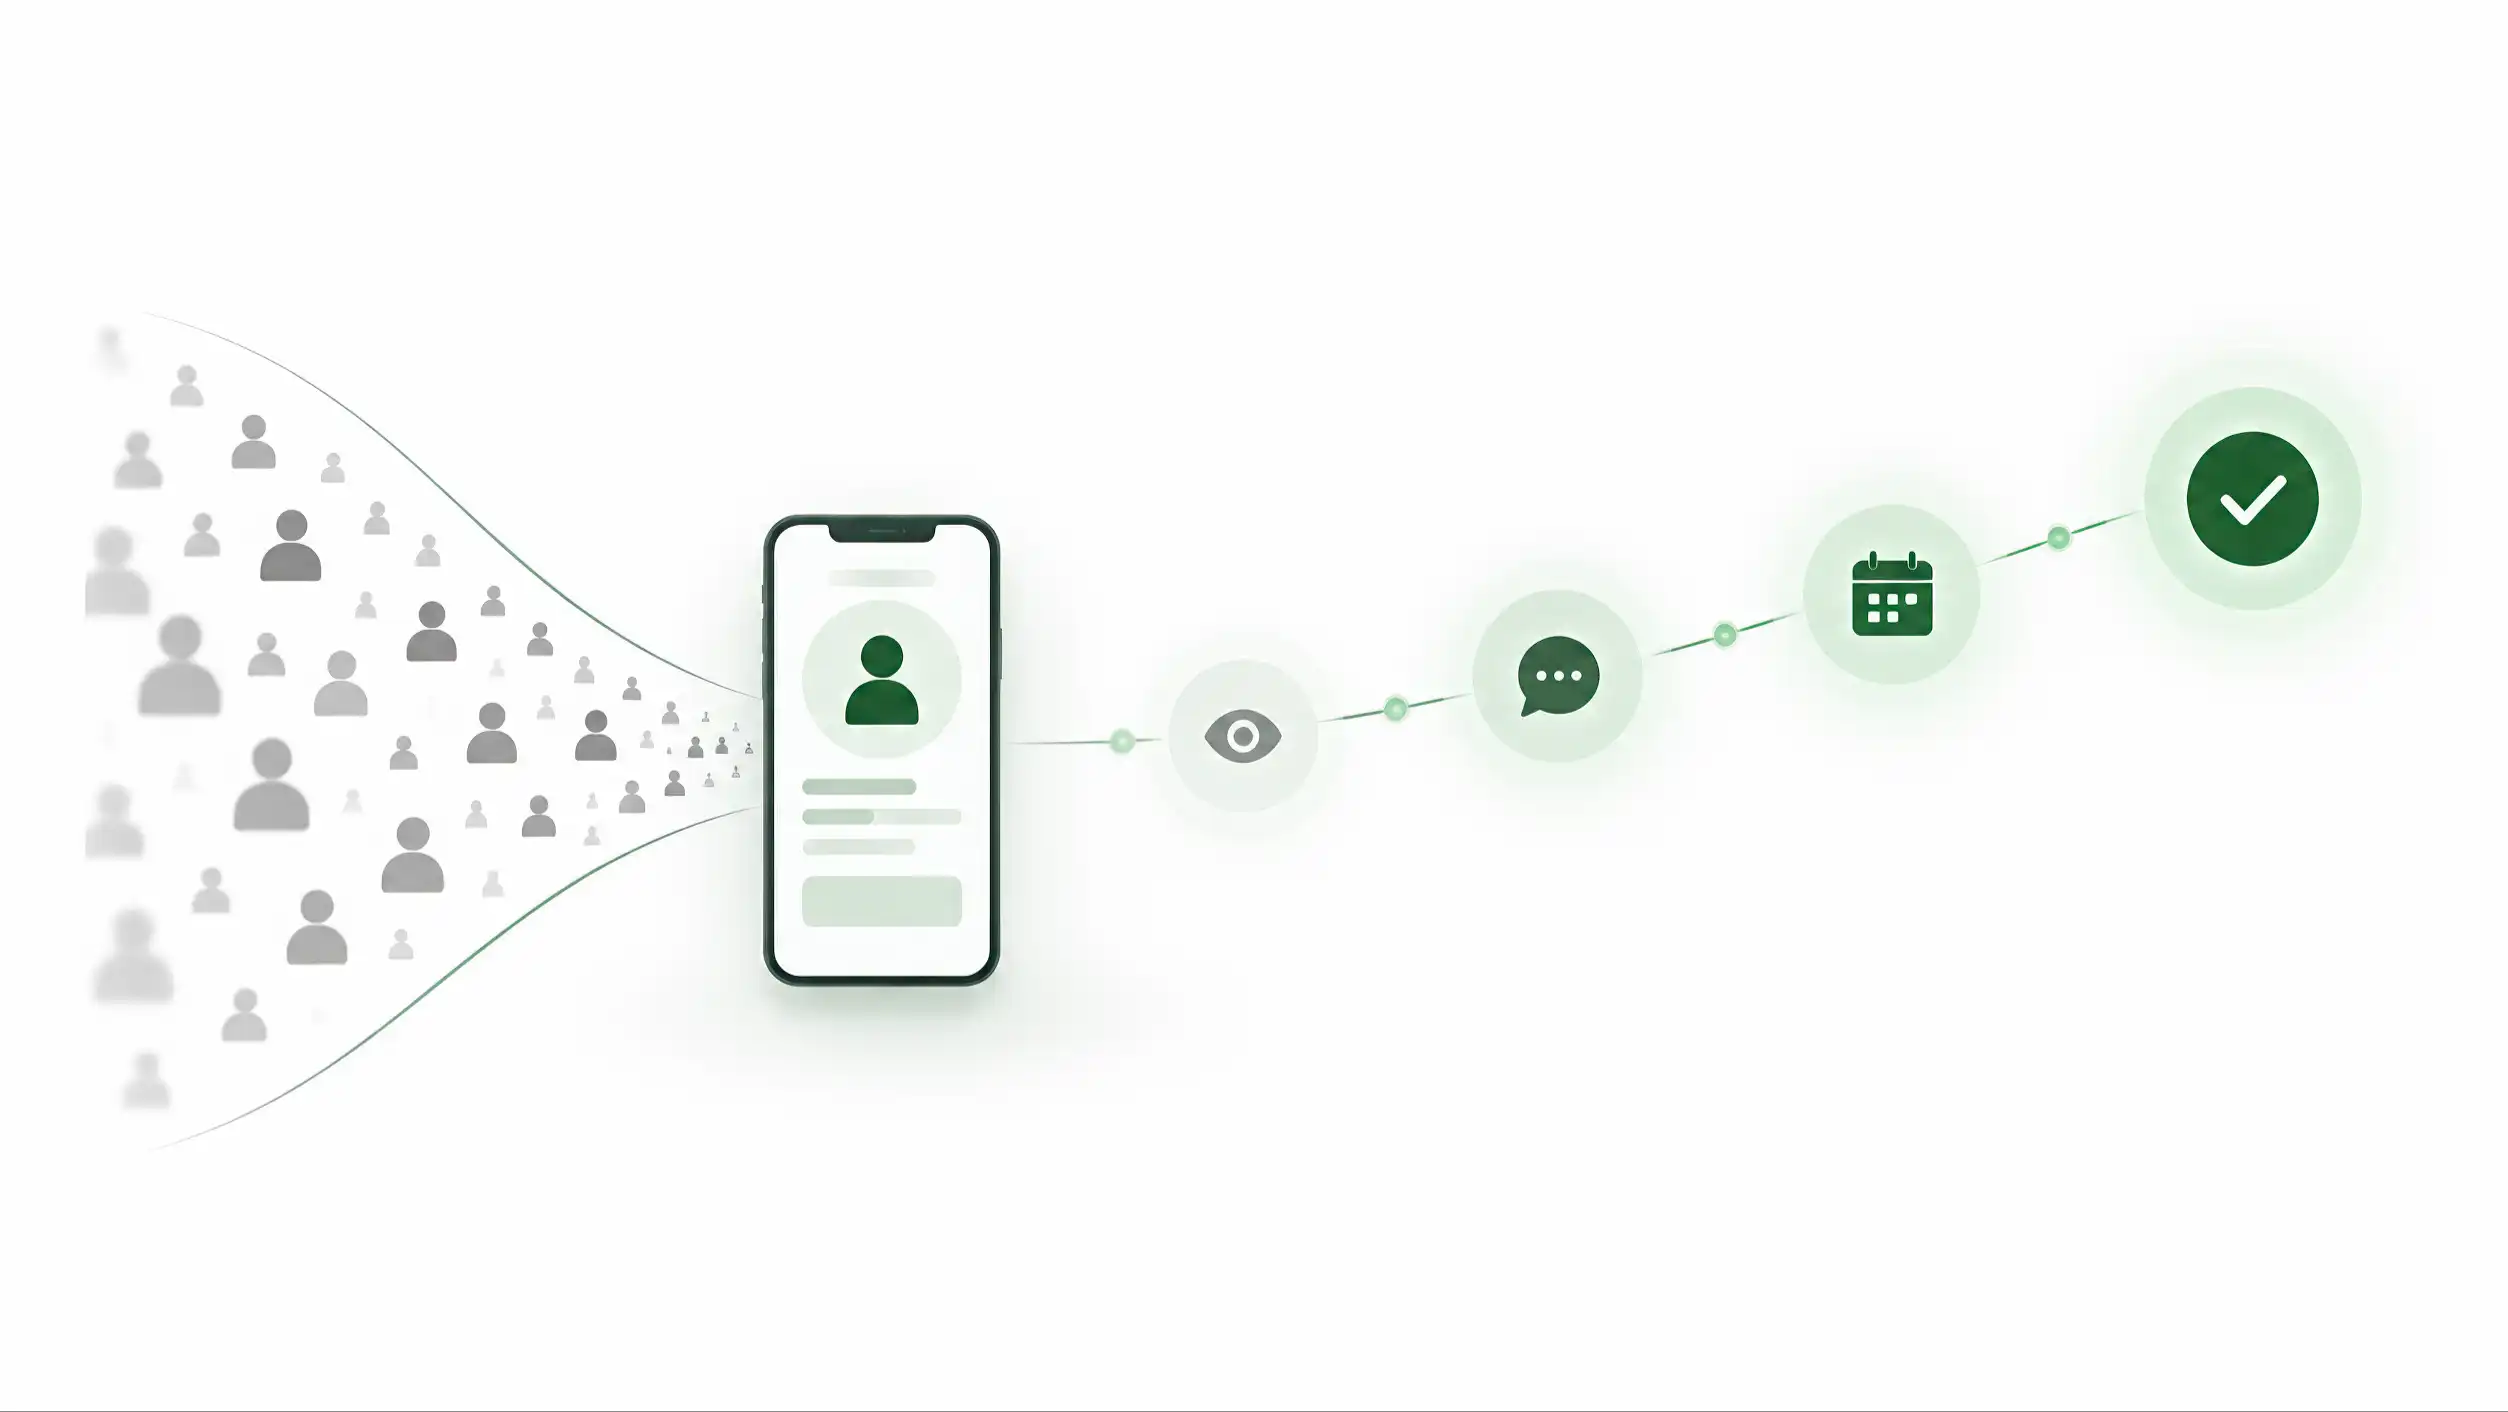
Once the job is clear, actions can be grouped by the kind of evidence they provide. A practical four-level model is attention, consideration, high intent, and verified outcome. The categories are useful because they prevent a scroll from sitting next to a completed order as if the two events were equivalent.
Attention signals show that the experience was reached or explored. Examples can include a profile open, meaningful scroll depth, expansion of a section, or viewing secondary content. These signals are useful for diagnosing reach and engagement, but they usually say little about commercial intent on their own.
Consideration signals suggest that the visitor is evaluating the person, offer, product, or place. Examples may include viewing services, opening a portfolio, visiting a website, saving a contact, checking a location, opening pricing, or examining a product. They are stronger than simple presence because the visitor is actively seeking more information.
High-intent actions indicate a deliberate attempt to move the relationship forward. Depending on the use case, these can include starting a call, launching WhatsApp, opening a booking flow, beginning an enquiry, requesting directions to a venue, initiating checkout, or entering a review flow. They are valuable because they are close to a decision, but “close” is not the same as “completed.”
Verified outcomes require evidence beyond the initial click. A submitted enquiry, completed booking, confirmed purchase, recorded lead in the CRM, or another server-confirmed success can belong here. The exact definition should be agreed with the business owner before implementation.
Google Analytics uses the product term “key event” for an event that represents an action particularly important to business success. That concept is useful, but the software label should follow the business definition rather than create it. Marking an event as important in a tool does not make it commercially important by itself.
The hierarchy should also allow exceptions. A save-contact action can be high intent at a networking event. Directions can be high intent for a restaurant or clinic. A social follow can be strategically important for a creator. The category should be configured by profile type or business objective, not hard-coded as universal truth.
The most important benefit of the hierarchy is not the labels themselves. It is the discipline of declaring what each signal means. When a dashboard can separate attention from consideration, intent, and outcome, the team can ask better questions. Are people seeing the profile but not investigating? Are they investigating but not acting? Are they acting but failing to complete? Those are different problems and need different responses.
A hierarchy also creates a cleaner interface. The top-level dashboard can emphasize high-intent actions and outcomes while allowing attention signals to remain available for diagnosis. The interface should reflect the hierarchy of business meaning, not the raw order in which event data arrives.
Alt text EN
Four-level action hierarchy from attention to consideration, high intent, and verified outcome
An event name without context is weak evidence
An event called “click” tells very little. Even “WhatsApp click” can be ambiguous if the business has multiple profiles, languages, sections, campaigns, and entry points. The same action can mean something different depending on where it happened and what brought the visitor there.
Google Analytics describes event parameters as additional data that provides context and detail about an interaction. The principle is broader than any one analytics platform: an event becomes more useful when it carries the dimensions needed to interpret it.
For a digital profile, useful context can include the action type, profile or service type, language, entry point, section, destination category, campaign source, and timestamp. In some implementations device category or broad geography may be useful. The correct set depends on the decisions the business needs to make.
Consider three records. “Click” is almost useless. “WhatsApp click” is better. “WhatsApp intent from the Arabic pricing section, reached through a QR stand during Campaign A” can support an actual comparison. It can help the team ask whether one language, placement, entry point, or section generates more valuable behavior.
Context should be designed, not improvised. A measurement specification should define allowed values. If one developer sends `whatsapp`, another sends `WhatsApp`, and a third sends `wa_click`, reporting becomes fragmented. If language is sometimes `ar`, sometimes `Arabic`, and sometimes missing, comparison becomes unreliable. Consistent naming is a data-quality requirement, not a cosmetic preference.
The same applies to profile identifiers. A public UID or internal analytics-safe identifier can support aggregation across time even if the visible profile title changes. But analytics parameters should avoid casually carrying personal data that is not needed for the measurement purpose. A metric should collect enough context to answer the question, not every piece of information available on the page.
Tullis and Albert’s Measuring the User Experience emphasizes choosing metrics that fit the question and then collecting and presenting them in a way that supports interpretation. That principle applies directly here. The event schema should be derived from the question the team expects to answer.
A practical event definition can therefore contain: event name, plain-language meaning, exact trigger, required parameters, optional parameters, allowed values, exclusions, deduplication rule, and example interpretation. This small amount of documentation prevents a large amount of confusion later.
Good context also makes future changes safer. If the interface moves a WhatsApp button from the hero to a contact section, the action can still be compared because the event meaning is stable and the location is carried as context. The analytics model should survive reasonable UI changes without losing its history.
Define trigger semantics before you trust the number
An event can have a good name and still be wrong. The next question is when exactly it fires. Small implementation choices can double counts, miss valid actions, or create numbers that look precise but do not represent what happened.
Suppose the user taps a WhatsApp button. Should the event fire on pointer-down, on click, after the browser accepts the navigation, or after an external app opens? On the web, the analytics system may be able to observe the click but not the full behavior inside the external application. The implementation should therefore name the event according to what can actually be observed. `whatsapp_intent` or `whatsapp_click` is more honest than `whatsapp_conversation_started` unless conversation start is independently confirmed.
Duplicate events are another common problem. A visitor can double-tap. A component can bind the same handler twice. A single interface action can trigger both a generic click event and a custom event. A page can be restored from browser history and re-run initialization logic. Without a clear rule, one human action can become two or three analytics records.
The measurement specification should define deduplication behavior. Some events should be counted every time because repetition is meaningful. Others may be limited to one occurrence per page view, per session, or per unique action identifier. The rule depends on the event. There is no universal deduplication setting.
Timing matters too. A contact-save button might open a vCard immediately, so the observable event is the download or launch attempt. A form is stronger when the server confirms successful submission rather than when the user merely taps “Send.” A booking flow may need separate events for booking start and booking confirmation. An ecommerce flow should distinguish checkout initiation from confirmed purchase.
Instrumentation also needs test cases. Before publishing, verify the event on mobile and desktop, Arabic and English, logged-in and logged-out states where relevant, different browsers, and all supported entry routes. Confirm that one action produces the expected number of records and that parameters have the expected values. Use real physical NFC and QR entry points where those paths exist, not only direct browser URLs.
A simple QA sheet can list each event with expected trigger, expected parameters, and expected count for a scripted scenario. Run the scenario after major releases. Analytics is part of the product and needs regression testing just like routing, forms, or payments.
This technical discipline protects the editorial hierarchy defined earlier. If the event data is noisy or duplicated, ranking actions by intent becomes meaningless. The dashboard can only be as trustworthy as the triggers underneath it. Before asking whether a number is good or bad, first confirm that the number means what the label says it means.
Separate interaction, intent, and verified outcome
One of the most important rules in digital-profile analytics is to stop one step short of claiming what the system cannot know. A click is evidence of interaction. It may also be evidence of intent. It is not automatically evidence of business outcome.
A WhatsApp tap indicates that the visitor attempted to open the channel. It does not prove that a message was sent, read, answered, qualified, or converted into revenue. A call tap indicates an attempt to dial; it does not prove that the call connected. A directions tap indicates navigation intent; it does not prove an in-store visit. A review-route tap does not prove that a public review was submitted. A booking-button click does not prove a confirmed appointment.
The analytics model should preserve these distinctions in names and reports. Use one event for the observable interface action and a different event for a confirmed result when confirmation is available. For example: `booking_start` and `booking_confirmed`; `form_start` and `generate_lead`; `checkout_start` and `purchase`. The exact names can vary, but the semantic separation should remain clear.
Google Analytics’ distinction between ordinary events and “key events” is helpful as an interface concept: some recorded actions matter more to business success than others. But even a key event can still represent intent rather than final outcome if that is how the event is defined. The label should not encourage the team to overstate what happened.
When the business has a CRM, booking system, ecommerce backend, or another source of truth, richer measurement becomes possible. A profile click can be connected to a confirmed lead or order through an appropriate identifier and lawful data flow. Even then, attribution should be described carefully. A customer may scan a QR code, return later by direct link, speak to a salesperson, and buy offline. One touchpoint rarely deserves full causal credit without stronger evidence.
For organizations without backend integration, honest intent metrics are still valuable. Knowing that one profile produces more qualified call attempts, saved contacts, or booking starts can inform design and distribution decisions. The limitation should simply remain visible.
This is also where event naming protects the team. Names such as `call_intent`, `booking_start`, or `review_route_open` carry their uncertainty in the label. Names such as `call_completed`, `booking_completed`, or `review_submitted` should be reserved for events with evidence that those outcomes occurred.
A mature dashboard can therefore show three layers: interaction signals, high-intent actions, and verified outcomes. That structure makes the report more honest and more useful. It prevents an impressive click count from being presented as customers, while still preserving the value of early signals that help the team understand behavior before the final outcome is visible.
Alt text EN
A clear separation between interface interaction, high-intent action, and a separately verified business outcome
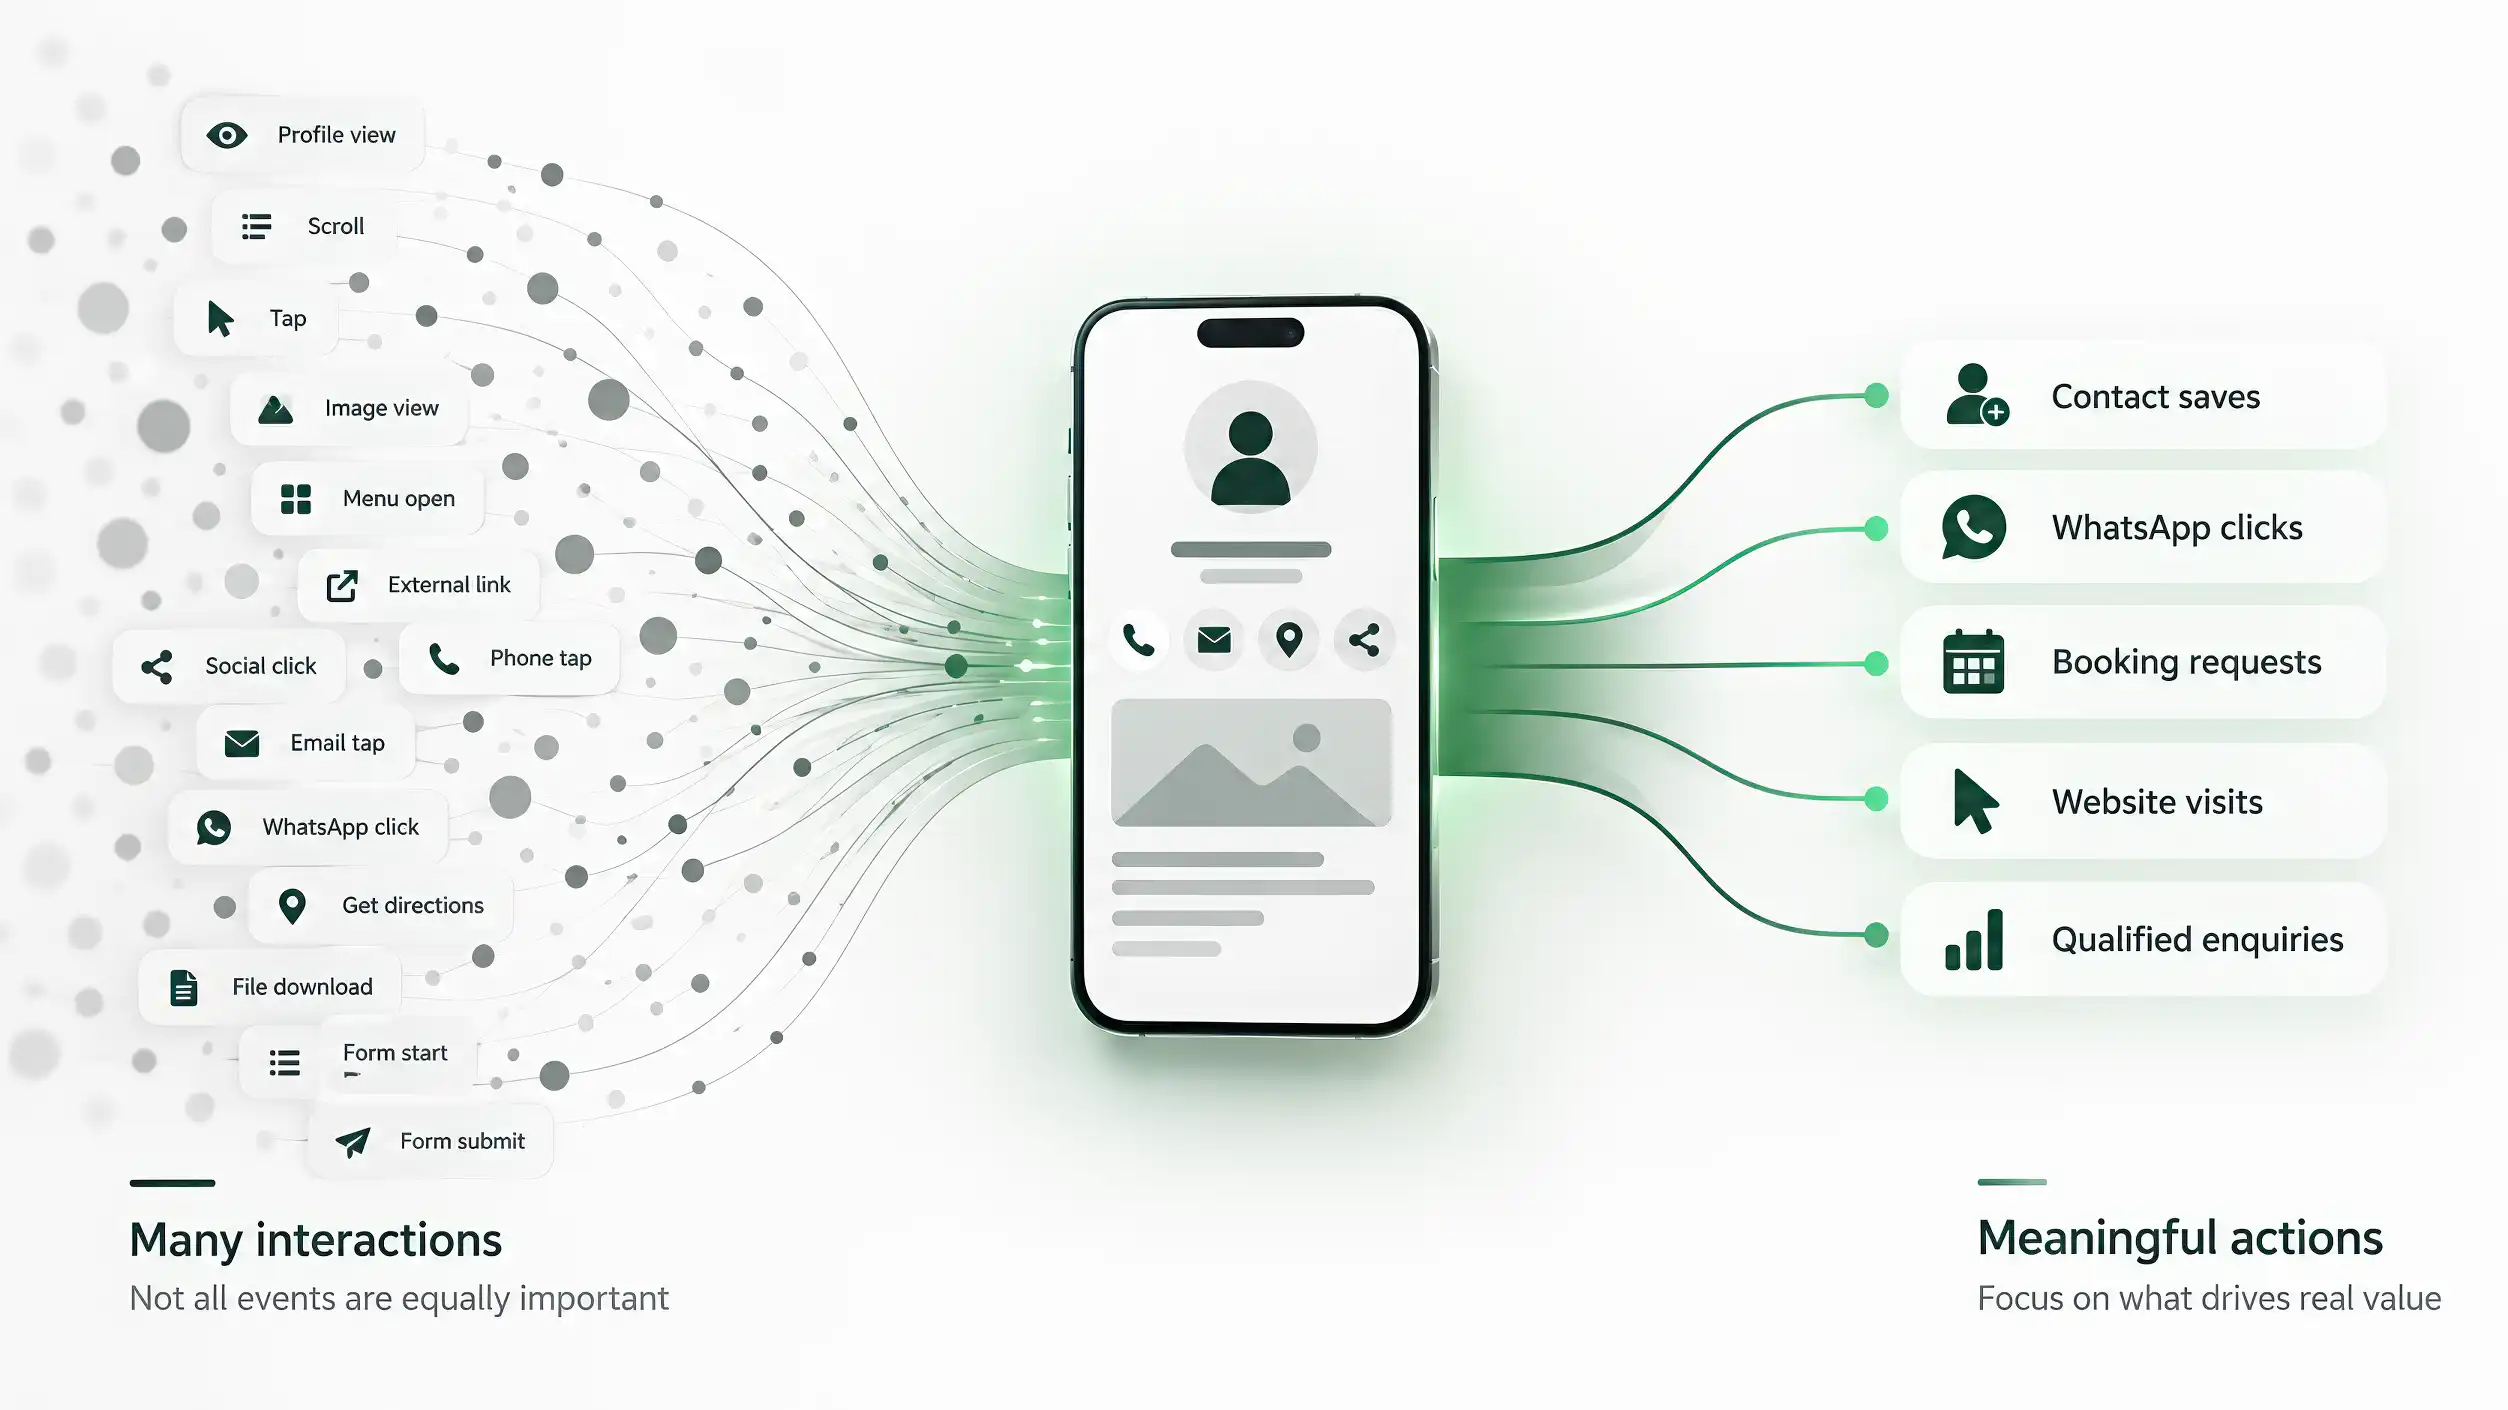
A useful dashboard is selective, layered, and comparable
Once events are defined correctly, the dashboard should not simply reproduce the entire event table. A useful top level is selective. It shows the handful of signals that help an owner or operator understand whether the profile is doing its job.
The exact set varies, but a top-level view may include profile opens, one or two high-intent action groups, confirmed outcomes when available, the most common useful actions, and a trend over time. A second layer can expose breakdowns by language, entry point, profile, section, campaign, or device. Raw event detail can remain available for investigation rather than occupying the first screen.
This is consistent with the discipline described in Lean Analytics: focus matters. A team that watches every number equally has no priority. A dashboard is an interface for decisions, so its information hierarchy should reflect business importance.
Comparability matters as much as selection. Two charts are only comparable when they represent the same event semantics. A trend becomes misleading if trigger rules, deduplication, required parameters, or outcome definitions change silently. Arabic and English profiles, different entry points, and different profile types should use aligned definitions whenever the dashboard is expected to compare them.
Definition changes should remain visible. If an event moves from “button clicked” to “server-confirmed success,” the reporting layer should not stitch the two periods together as if the measure were unchanged. Version boundaries, migration notes, or explicit annotations protect the historical record and keep later analysis interpretable.
Avoid building composite scores too early. Assigning arbitrary weights—one point for a scroll, five for a call, ten for a booking—can collapse distinct evidence into a neat number that hides assumptions. If a score is ever used, its inputs and weights should be documented and tested. Until then, the underlying intent categories are usually clearer.
Cross-profile comparisons should expose structural differences instead of smoothing them away. If one profile confirms bookings server-side while another can observe only booking starts, those signals should remain separate. The dashboard should compare like with like and make measurement limitations visible when the evidence is not equivalent.
The best dashboard therefore works in layers. The first layer answers “Are important actions happening?” The second asks “Where and for whom?” The third allows investigation of detailed events and parameters. Each layer supports a different level of decision without forcing every user to read the raw data.
Selectivity is not hiding information. It is information architecture applied to analytics. The important numbers are visible first; supporting evidence remains accessible; and every metric has a reason for occupying the space it uses.
Treat measurement as a product specification, not a one-time setup
A measurement system changes as the product changes. New buttons appear. Old flows disappear. Languages are added. A direct link becomes a booking integration. A review route moves to a new provider. If analytics is treated as a one-time installation, the event model slowly drifts away from the product until the dashboard labels no longer match reality.
The solution is lightweight governance. Maintain an event catalog. Each important event should have an owner, a versioned definition, trigger conditions, required context, interpretation limits, and a test case. When the product changes, the catalog is reviewed with the release.
A practical record can include: event name; business meaning; intent category; exact trigger; required parameters; optional parameters; deduplication rule; whether it is a top-level metric or diagnostic detail; whether a confirmed outcome exists; and which teams consume it. This turns analytics from tribal knowledge into an operational specification.
Naming should be stable. Renaming events casually breaks longitudinal analysis. If a meaning changes materially, consider creating a new version rather than silently reusing the old name. If only the interface label changes while the business meaning remains the same, preserve the analytics event and update context where needed.
Retirement matters too. When an event is no longer produced, document when it stopped and why. Dashboards that mix old and new event definitions can create false trends. Historical data cannot always be rewritten, so the reporting layer needs to know where the definition changed.
QA should be part of release acceptance. A major profile redesign is not complete until important events have been tested. A new Arabic section is not complete if its actions fire without language context. A new entry point is not complete if the source cannot be distinguished. A new booking integration is not complete if the dashboard still treats a booking start as a confirmed booking.
Periodic audits are useful even without large releases. Choose a sample of profiles and physical entry points, run known scenarios, and compare expected events with recorded events. Review events that have not fired for a long time. Look for parameters with unexpected values, duplicate spikes, or sudden drops that may indicate instrumentation failure rather than customer behavior.
The final standard is simple: every important metric should have a definition, a reason, and a test. Kaushik’s outcome-oriented analytics, Lean Analytics’ focus on actionable measures, Tullis and Albert’s emphasis on choosing metrics appropriate to the question, and Google Analytics’ event/key-event model all point in the same direction: measurement becomes useful when it is selective, interpretable, and tied to a purpose.
A digital business card does not need the largest event collection. It needs a measurement model that can distinguish attention from consideration, intent from outcome, and real change from tracking noise. When that model is documented and tested, analytics becomes part of the product’s operating system rather than a decorative counter attached to it.
Sources
- Web Analytics 2.0: The Art of Online Accountability & Science of Customer Centricity — Avinash Kaushik — Wiley
- Lean Analytics: Use Data to Build a Better Startup Faster — Alistair Croll, Benjamin Yoskovitz — O’Reilly Media
- Measuring the User Experience: Collecting, Analyzing, and Presenting UX Metrics, 3rd Edition — Bill Albert, Tom Tullis — Morgan Kaufmann / Elsevier
- About key events — Google Analytics — Google Analytics Help
- Event parameters — Google Analytics — Google Analytics Help