

Views measure reach, not business success
Profile views are easy to celebrate because the number is visible, cumulative, and simple to explain. A dashboard that moves from 1,000 to 5,000 opens feels like progress. Sometimes it is progress: more people have reached the profile. But reach and effectiveness are not the same thing. A view records that access happened. It does not tell the business whether the right person arrived, whether the visitor understood the offer, whether the page created confidence, whether a useful next step occurred, or whether that step eventually produced revenue, a qualified enquiry, a booking, a review, a saved contact, or another outcome the business actually cares about.
This distinction is central to serious analytics. Avinash Kaushik defines web analytics around using quantitative and qualitative data to improve the customer experience and translate that improvement into desired outcomes. That framing moves the discussion away from activity for its own sake. A large number of opens is evidence of distribution or visibility. It is not a final score for the value of the profile.
The danger appears when the business starts optimizing the easiest number instead of the most useful question. If management asks only, “How many people opened the profile?”, teams can increase distribution, place more QR codes, hand out more cards, or drive more clicks and make the graph rise. None of those actions guarantees that the additional visitors are relevant. The same campaign can create more traffic and lower efficiency at the same time if it attracts curiosity rather than people with a realistic reason to act.
This is why the denominator matters. A profile with 10,000 opens and 20 qualified enquiries is not automatically healthier than a profile with 2,000 opens and 60 qualified enquiries. The first has greater reach; the second may be turning a smaller audience into useful business activity more efficiently. Those are two different achievements and should be reported separately.
The point is not to dismiss views. They remain important. Without enough reach, no lower stage of the journey has room to grow. Views can help evaluate distribution, compare entry points, understand seasonality, and identify whether a campaign generated attention. The mistake is to let one top-of-funnel count stand in for the entire customer journey.
A stronger reporting habit therefore uses two questions together: “How much reach did we create?” and “What did that reach produce?” The first protects the value of distribution. The second protects the business from confusing attention with impact. Once both questions are visible, the team can decide whether the next problem to solve is insufficient reach, weak conversion, poor lead quality, or a downstream process that fails after the profile has done its job.
Use a funnel to separate arrival from outcome
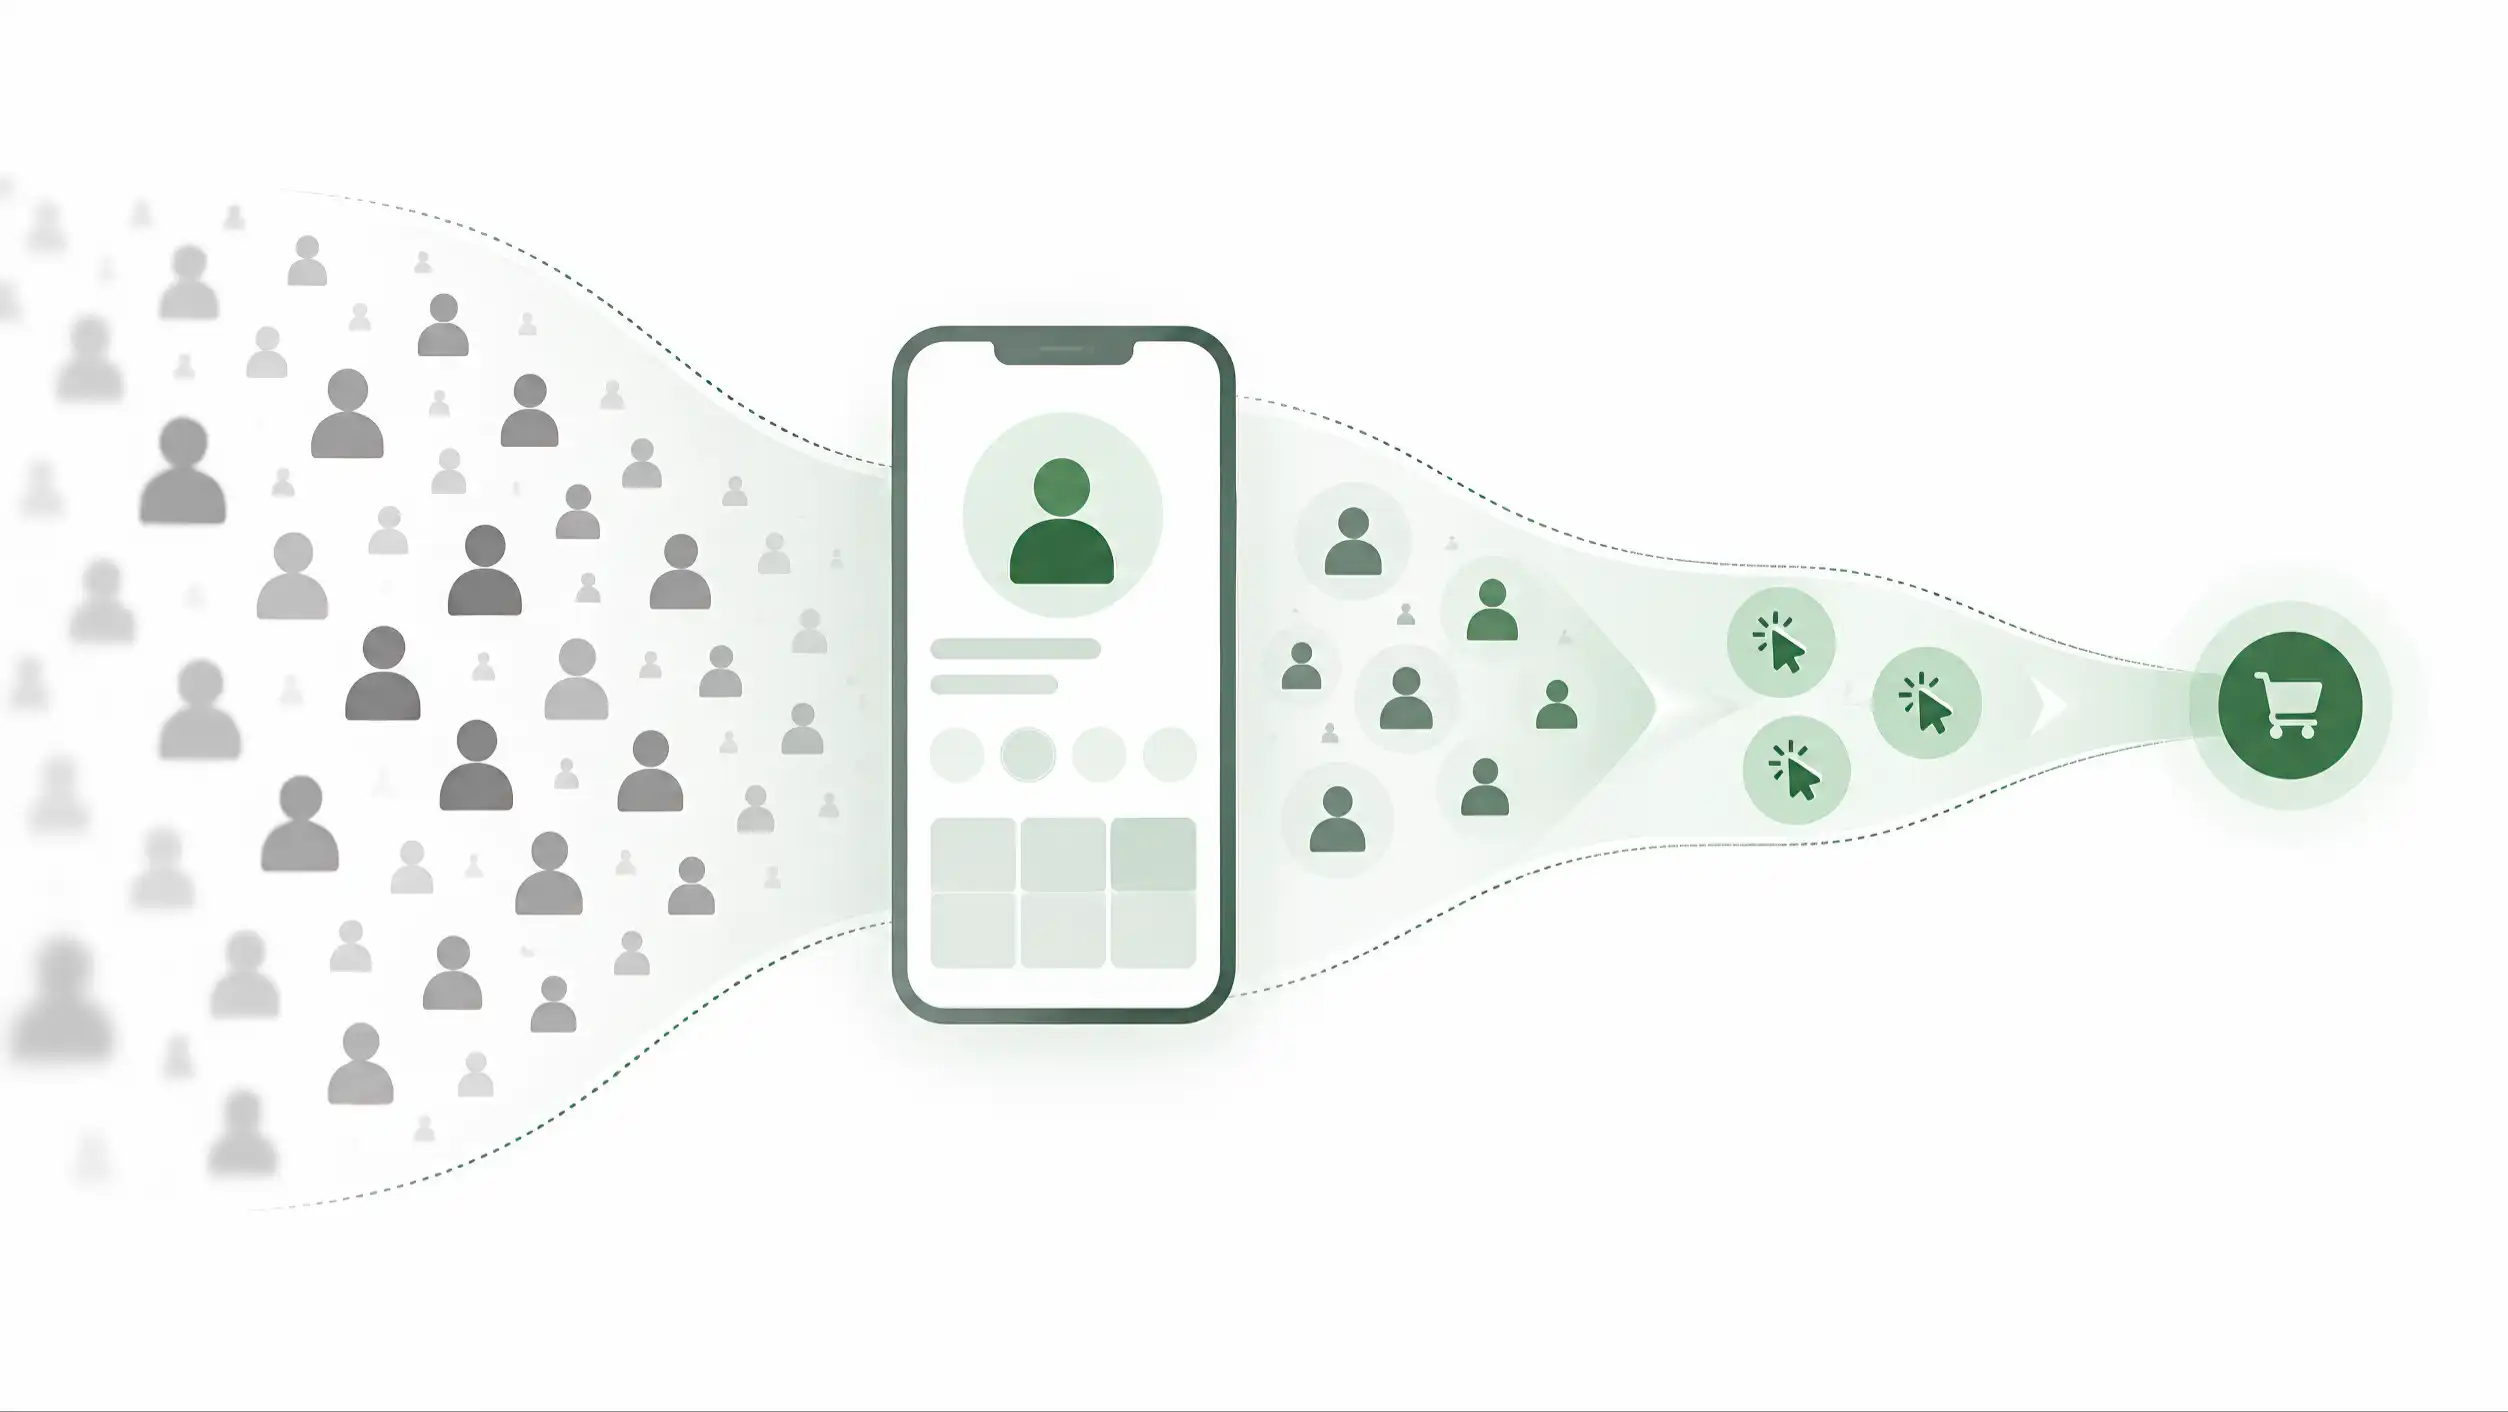
A useful way to evaluate performance is to separate the journey into stages rather than compress everything into a single counter. The exact model can vary by business, but a practical starting point is: Open → Meaningful Engagement → Useful Action → Business Outcome. These stages are not a universal law and they are not intended to replace the more detailed event framework discussed elsewhere in this series. Their purpose is diagnostic: they show where volume is being lost as people move from attention toward business value.
Open answers whether the profile was reached. Meaningful engagement asks whether the visitor did enough to suggest that the page was relevant to the task: for example, exploring information rather than immediately leaving. Useful action asks whether the visitor chose a next step that the profile was designed to support. Business outcome moves beyond the page and asks whether the action produced something the business recognizes as valuable, such as a qualified enquiry, completed booking, submitted application, purchase, confirmed review, or another defined result.
The advantage of this structure is not the terminology. It is the separation of questions. If opens are weak, the problem may be distribution or discoverability. If opens are strong but meaningful engagement is weak, the audience, promise, speed, or first-screen experience may be wrong. If engagement is strong but useful actions are weak, the offer or next step may be unclear. If useful actions are strong but business outcomes are weak, the break may be outside the profile: response time, pricing, availability, sales follow-up, or lead quality.
A funnel therefore prevents teams from repeatedly redesigning the wrong layer. Without stages, every disappointing result can be blamed on “the profile.” With stages, the team can ask where the largest loss occurs and investigate that part of the system first. This is especially important because digital profiles often sit between physical distribution and downstream business processes. They are one layer in a wider system, not the whole commercial engine.
The funnel also makes growth easier to interpret. Suppose opens rise 80 percent after a campaign but business outcomes rise only 5 percent. The campaign clearly expanded reach, yet most of the extra attention did not travel through the rest of the journey. That does not automatically mean the campaign failed; perhaps awareness was the objective. But if the goal was enquiries or bookings, the mismatch deserves investigation.
The reverse can also happen. Opens may stay flat while business outcomes increase substantially after the profile is simplified, the offer becomes clearer, or the audience mix improves. A view-only dashboard could miss that progress completely because the headline number did not move.
For reporting, keep the model simple enough that non-technical teams can use it. Show the count at each stage, the rate between stages, and the business definition of the final outcome. Avoid filling the funnel with every recorded event. Detailed event priority belongs in the measurement framework of Article 06. Here the goal is narrower: preserve the difference between arrival, progress, action, and outcome so the business can see whether attention is becoming useful.
Higher traffic can hide lower efficiency
Consider two digital profiles over the same reporting period. Profile A receives 10,000 opens. Profile B receives 4,000. If the dashboard stops at reach, A appears decisively stronger. Now add the next stages. Suppose A produces 900 meaningful engagements, 250 useful actions, and 40 qualified enquiries. B produces 1,400 meaningful engagements, 520 useful actions, and 95 qualified enquiries. The smaller audience is creating more qualified opportunities.
These figures are deliberately illustrative. They are not a benchmark for ADMAL, the UAE, digital business cards, or any industry. Their only purpose is to expose the difference between volume and efficiency. A business must never copy the rates from an example and treat them as a target without evidence from its own context.
The example shows why totals can mislead when the size of the audience changes. Profile A may still be valuable: perhaps its role is broad awareness, perhaps it sits at a high-traffic location, or perhaps its 40 enquiries are exceptionally valuable. Profile B may be highly efficient because it is distributed in a narrow professional context. The correct conclusion is not that B is universally “better.” The correct conclusion is that the two profiles are doing different amounts of work per unit of attention, and the business needs to understand why.
Marketing Metrics by Neil Bendle, Paul Farris, Phillip Pfeifer, and David Reibstein is useful here because it emphasizes disciplined definitions and quantitative measures for evaluating marketing performance. Ratios such as conversion rate exist precisely because raw volume and effectiveness answer different questions. A denominator creates context for a numerator.
This matters when comparing locations, campaigns, teams, products, or entry points. A stand in a busy reception can generate thousands of scans from mixed intent. A card handed to qualified prospects after a sales conversation may receive fewer opens but a higher proportion of serious next steps. A profile linked from social media may attract large exploratory traffic, while a QR on a quotation or invoice reaches people with an existing relationship. Comparing totals without acknowledging these contexts can reward the wrong channel.
Efficiency can also deteriorate while totals rise. Imagine a campaign doubles opens but triples the number of low-relevance visitors, increasing support noise while qualified enquiries remain unchanged. The campaign “grew” the traffic graph and made the operating team busier, but it did not improve the business outcome. If management sees only reach, it may allocate more budget to the same source.
The practical lesson is to report volume and efficiency side by side. Show opens because scale matters. Show the next-stage rates because quality matters. When possible, show the actual downstream outcome too. The conversation then changes from “Which profile has the biggest number?” to “Which source creates the most useful progress, at what scale, and for what business purpose?” That is a much stronger basis for deciding where to invest.
Ratios are useful only when the denominator is honest
Ratios make different traffic volumes comparable, but a percentage can mislead just as easily as a raw count if the denominator is poorly defined. Before comparing conversion efficiency, the business must decide what population each rate actually represents. “Action rate” can mean actions divided by opens, actions divided by engaged visits, unique people who acted divided by unique visitors, or sessions with at least one action divided by sessions. Those are not interchangeable metrics.
A practical scorecard should therefore define each formula in plain language. Engagement rate might be engaged opens divided by valid opens. Useful-action rate might be openings in which at least one relevant action occurred divided by valid opens. Qualified-enquiry rate might be qualified enquiries divided by valid opens, or divided by useful actions if the purpose is to evaluate downstream quality. Actions per opening is a different measure again because one visitor can perform multiple actions.
The word “valid” matters. Automated traffic, internal testing, duplicate instrumentation, accidental reloads, or repeated opens from the same person can distort the top of the funnel. The right cleanup depends on the analytics system, but the principle is universal: a denominator should represent the opportunity you intend to measure. If the tracking definition changes midway through a comparison, the rate can move even when user behavior does not.
Ratios also behave differently at small sample sizes. A profile with four opens and one enquiry has a 25 percent enquiry rate, but that does not make it a proven 25 percent converter. One additional outcome would move the rate dramatically. Small denominators create unstable percentages. Teams should show the underlying counts beside the rates and avoid celebrating large percentage swings when only a handful of observations are involved.
This is one reason Lean Analytics is useful. Alistair Croll and Benjamin Yoskovitz distinguish vanity metrics from metrics that help a team make decisions, and they discuss segmentation, cohorts, and the need to define meaningful measures. A ratio becomes actionable when its definition is stable, its sample is sufficient for the decision being made, and the team knows what change it is trying to detect.
There is also no universal “good conversion rate” for a digital profile. A networking card, a restaurant stand, a review request, a recruitment profile, and a high-ticket consulting profile serve different jobs. Their denominators, time horizons, and outcomes differ. External benchmark numbers can be interesting, but they should not replace internal baselines and business economics.
A stronger practice is to establish a baseline from your own system, document the formula, monitor the rate over comparable periods, and investigate changes large enough to matter operationally. Always keep the count visible beside the percentage. The count shows scale; the rate shows efficiency; the definition tells you what either number actually means.
Conversion is not enough if the outcome is low quality
A profile can improve its action rate and still fail to create better business. This happens when the metric stops too early. If a team celebrates every WhatsApp tap, form submission, booking-page visit, or call tap as a “conversion,” the dashboard can look healthy while the downstream team receives irrelevant enquiries, duplicate requests, price-only shoppers, accidental actions, or people outside the service area.
The solution is not to ignore actions. Actions remain evidence that the profile moved the visitor forward. The solution is to connect the top-of-funnel measurement to a business-quality definition. For a service business, that might be a qualified enquiry: someone with the right need, location, budget range, and timing. For ecommerce it may be a completed purchase or contribution margin. For appointments it may be a completed booking that is actually attended. For recruitment it may be an eligible application rather than a click on “Apply.”
Marketing Metrics is particularly relevant because marketing performance ultimately has to connect activity with financially or strategically meaningful outcomes. Laurent Florès makes a similar point in How to Measure Digital Marketing: metrics become useful when they assess effectiveness and inform the design of better marketing, not when they merely count digital interactions.
This quality layer changes how two channels should be compared. Imagine Source A produces 300 contact actions and 20 qualified enquiries. Source B produces 120 contact actions and 45 qualified enquiries. If the dashboard ends at contact clicks, A looks stronger. If the business needs qualified opportunities, B is doing more useful work. A may still have a role, but the next decision is different: improve targeting or qualification rather than simply buying more of the same traffic.
Quality also protects the team from optimizing interface tricks. A more aggressive button, pop-up, or prefilled message can increase click-through without increasing customer value. Sometimes it can even reduce trust. Optimization should therefore watch both the immediate behavior and the downstream result. A change that raises actions by 30 percent but lowers the proportion of business outcomes deserves scrutiny.
The exact quality definition must be operational. “Good lead” is too vague. Write criteria that the sales or service team can apply consistently. If the business cannot define the business outcome it is trying to create, it cannot reliably measure conversion efficiency. The definition may include eligibility, product fit, location, budget, urgency, or any factor that materially determines whether the enquiry can become useful business.
This section intentionally stops before building a detailed hierarchy of events. Article 06 owns that framework. The narrower principle here is that efficiency should continue far enough down the journey to reflect value. Views tell you reach. Actions tell you direction. Business outcomes tell you whether the direction produced something worth pursuing. A strong dashboard keeps all three visible so the team does not optimize one layer at the expense of the next.
Compare like with like: cohorts, sources, and time windows
Lifetime totals are useful for showing cumulative reach, but they are poor at telling you whether performance is improving now. Every old success remains inside the total forever. A profile can deteriorate for months while its lifetime views continue to rise. To understand change, teams need defined comparison windows and cohorts.
A cohort is simply a group that shares a useful characteristic: visitors who arrived during the same week, from the same campaign, through the same entry point, after the same profile version, or from the same location. Comparing cohorts allows the business to ask more precise questions. Did visitors from the event behave differently from visitors who received a card after a sales meeting? Did the new profile version improve the rate of qualified enquiries? Did QR traffic from packaging behave differently from direct-link traffic in email?
The comparison must be fair. Seasonality, weekday mix, campaign spending, staff response time, offer changes, holidays, product availability, and audience composition can all alter outcomes. A before-and-after difference is evidence of change, not automatic proof of cause. If the profile changed at the same time as the price, ad targeting, and sales team, the dashboard cannot isolate which change produced the result.
This is where the work of Ron Kohavi, Diane Tang, and Ya Xu is useful. Trustworthy Online Controlled Experiments explains the discipline required to infer causality from online tests: clear metrics, proper randomization, sufficient data, guardrails, and careful analysis. Most ADMAL customers will not run a formal controlled experiment for every profile edit, and they do not need to. But the discipline still improves everyday reporting: compare similar populations, document what changed, define the observation period, and avoid claiming more certainty than the design supports.
Even simple comparisons benefit from this rigor. If a new headline appears to improve useful-action rate, check whether the entry sources stayed similar. If NFC traffic seems to convert better than QR traffic, ask whether the two entry points are used in the same context. If one month outperforms another, check whether a campaign or holiday changed the audience. Context can create a difference that has nothing to do with the interface itself.
When enough traffic exists, a controlled experiment can provide stronger evidence. Split comparable visitors between two versions, choose a primary metric before the test, watch guardrail metrics so one improvement does not create another problem, and run long enough to avoid reacting to noise. For low-traffic profiles, formal experimentation may be impractical; repeated cohort comparison and qualitative feedback can still produce useful evidence if the team remains cautious.
The main reporting rule is simple: never present a rate without its period, population, and denominator. “Conversion improved to 12%” is incomplete. Improved from what, over which dates, for which source, using what definition, and with how many observations? Those details are not bureaucracy. They are what turns a number into evidence.
Diagnose the leak before buying more reach
When results disappoint, the instinctive response is often to increase traffic. Hand out more cards, add more stands, place more QR codes, increase advertising, or push the link through more channels. More reach can be the correct answer when the top of the funnel is genuinely too small. But if the existing funnel is inefficient, scaling distribution can simply scale the waste.
Imagine that 20 percent of valid opens become useful actions and 25 percent of those actions become qualified enquiries. If the business can preserve those rates, more relevant traffic may create more outcomes. Now imagine only 2 percent of opens produce useful actions because the first screen is confusing, the audience is poorly matched, or the offer is unclear. Doubling traffic before fixing the problem doubles the number of people exposed to the same friction.
The diagnostic sequence should follow the funnel. If reach is low but downstream rates are healthy, invest in distribution. If reach is strong and engagement collapses, inspect the promise, audience fit, speed, language, and immediate clarity. If engagement is healthy but actions are weak, inspect the offer, hierarchy, and next-step design. If actions are healthy but business outcomes are weak, inspect targeting, qualification, pricing, availability, sales response, and the downstream channel.
This is where conversion efficiency becomes financially useful. It helps decide where the next dirham, hour, or development sprint should go. A business that cannot separate reach from efficiency risks spending more money to feed a system that leaks at the same point. The extra traffic may create larger absolute numbers while return on effort deteriorates.
Cost should therefore enter the analysis when acquisition is paid or operationally expensive. Cost per open can show distribution efficiency, but cost per useful action and cost per business outcome are closer to business value. A campaign with cheap clicks can be expensive if very few become useful enquiries. A more expensive channel can be efficient if it brings a smaller but much more relevant audience. The right economic measure depends on the business model, but the principle is stable: connect spending to the stage that matters.
The same idea applies to physical production. Printing and distributing more NFC cards, tags, stands, or QR materials has a cost. Before scaling a weak experience, use the existing traffic as a diagnostic sample. Fix obvious friction, verify the destination, define the intended outcome, and make sure the tracking is reliable. Then expand distribution with a better baseline.
Not every funnel needs to be maximized. A review stand may intentionally send a satisfied customer away from the profile almost immediately. A networking profile may succeed when a contact is saved quickly. A high-consideration service may require several visits. The purpose of diagnosis is not to force all journeys into one shape; it is to find whether the observed behavior matches the job the profile is supposed to perform.
The decision at the end of the analysis should be concrete: buy more reach, improve the experience, improve targeting, change the offer, improve follow-up, or collect better evidence before acting. If the analytics cannot help choose among those options, the dashboard is reporting activity rather than supporting management.
Build a scorecard that changes decisions
The purpose of analytics is not to make the dashboard denser. It is to reduce uncertainty around a decision. A useful scorecard for a digital profile can therefore remain small. It needs enough information to show reach, conversion efficiency, outcome quality, and change over time, but not every event the system can technically collect.
A practical management view might include: valid opens; meaningful-engagement rate; useful-action rate; business-outcome count and rate; the most important downstream business result; and one or two segmented comparisons that matter to the current question, such as entry source or profile version. If acquisition has a meaningful cost, add cost per business outcome. Keep the definitions beside the report so the numbers cannot drift silently.
The scorecard should also distinguish leading and lagging indicators. Opens and useful actions can be observed quickly. Revenue, completed deals, repeat business, or lifetime value may appear much later. A team should not wait months to learn anything, but it also should not pretend an early click is equivalent to a final outcome. Use early indicators to manage the experience while periodically reconciling them with downstream results.
Review cadence matters. Daily checking can encourage overreaction when volume is low. Monthly reporting can be too slow for an active campaign. Choose a cadence that matches traffic and decision speed. For a small profile, a rolling multi-week window may be more stable. For a large campaign, daily monitoring may be justified for operational health while strategic decisions use longer periods.
A good report includes context notes. Record major changes to the profile, campaign, pricing, availability, audience, tracking, or sales process. Six months later, those notes explain why a line moved. Without them, teams can invent stories around old charts that no longer remember the operational reality.
Set decision rules where useful, but avoid fake precision. For example: if reach falls while conversion remains healthy, investigate distribution; if reach grows but business-outcome rate falls materially for several comparable periods, investigate audience quality; if useful-action rate improves after a change and downstream quality remains stable, consider expanding the change. These are decision patterns, not universal thresholds.
Most importantly, tie every metric to an owner and a possible action. Who responds if tracking breaks? Who reviews lead quality? Who decides whether a campaign source should be expanded? Who can change the profile? Analytics without ownership can identify a leak that nobody is responsible for fixing.
This is the final standard for Article 05: views belong in the report, but not on a throne. Reach tells you how many opportunities entered the system. Rates tell you how efficiently people moved. Business outcomes tell you whether the movement was useful. Cohorts tell you whether performance is changing. Economics tells you whether the result is worth the cost. When those layers are read together, a digital profile stops being judged by popularity and starts being managed by effectiveness.
Sources
- Web Analytics 2.0: The Art of Online Accountability & Science of Customer Centricity — Avinash Kaushik — Wiley
- Lean Analytics: Use Data to Build a Better Startup Faster — Alistair Croll, Benjamin Yoskovitz — O’Reilly Media
- Trustworthy Online Controlled Experiments: A Practical Guide to A/B Testing — Ron Kohavi, Diane Tang, Ya Xu — Cambridge University Press
- Marketing Metrics, 4th Edition — Neil Bendle, Paul W. Farris, Phillip Pfeifer, David Reibstein — Pearson FT Press
- How to Measure Digital Marketing: Metrics for Assessing Impact and Designing Success — Laurent Florès — Palgrave Macmillan / Springer